 |
|
|
| Topics Projects Collaborations Seminars Infrastructure |
| Boundary Layers |
| Investigation of magnetopause region with Cluster satellites |
|
Investigation of magnetopause region with Cluster satellites.
We are using a rich collection of methods to determine the geometry, dynamics and structure of the magnetopause (MP) region. These are single- or multi-spacecraft techniques, which either rely on certain conservation laws holding across a plasma discontinuity (like the minimum variance analysis (MVA) technique) either make use of the time-differences in the measurements acquired on-board the four Cluster satelites (like the timing analysis (TA) technique) or test whether the data comply with some discontinuity model (like the Walen and deHoffmann-Teller tests). The large variety of data and analysis tools provides a detailed picture and allows us to performe consistency checks and evaluate various assumptions underlying the models at the hard of these methods. |
 |
|
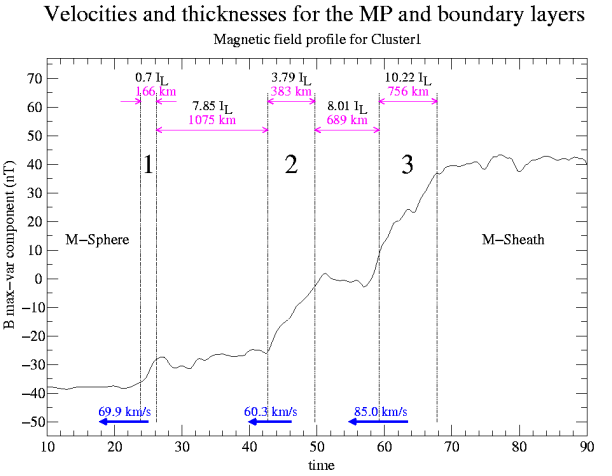
As an example of this kind of investigation we present here a figure
corresponding to an outbound MP crossing. The maximum variance magnetic
field component (i.e. perpendicular to the magnetopause normal) is shown
as a function of time for the case of Cluster1 satellite. Coming from
the magnetosphere the satellite samples data from a double boundary
layer (BL) before encountering the magnetopause itself (region 3) and
finally exits in the magnetosheath. Because the inner-edges of the two
BL regions posses a well-defined magnetic signature (the jumps in
regions 1 and 2) a timing analysis has been performed on them as well as
on the MP. On one hand this enable us to determine the thickness (shown
in km and also scaled with the local ion-inertial length) and velocity
of the structures observed during transition. On the other hand,
comparing the normal to the surface separating the inner and outer part
of the BL (region 2) provided by the TA and the normals inferred by
other methods we were able to conclude that this is a tangential
discontinuity. Indeed, by applying the MVA on the magnetic field, MVA on
the current density and the TA methods for this region and for the MP
region we obtained normals that all lye very close to each other (within
a cone of 3 degree). The mentioned tangential character of region 2
explains why the plasma from the two adjacent regions comprising the
double BL do not mix and suggests a possible different source or
formation-time for them.
|
|
References:
A. Blagau, et.al., "The dayside magnetopause in the spring of 2004: A case study and a statistical report." Deutsche Physikalische Gesellschaft Tagung, Heidelberg, 13-16 March 2006. A. Blagau, et.al., "Analysis of multiple current layers in the magnetopause region with Cluster", COSPAR, Beijing, 16-23 July, 2006 S. Haaland et. al., "Orientation and motion of a discontinuity from Cluster curlometer capability: Minimum variance of current density" Geo.R.L., vol. 31, no. 10, 2004, L10804 S. Haaland et. al., "Four-spacecraft determination of magnetopause orientation, motion and thickness: comparison with results from single-spacecraft methods", AnGeo. vol. 22, 2004, 1347 B. Sonnerup andM. Scheible, "Minimum and Maximum variance analysis", in Analysis Methods for Multi-Spacecraft Data, ISSI Scientific Reports, 1998 B. Sonnerup and A. Khrabrov, "DeHoffmann-Teller Analysis" in Analysis Methods for Multi-Spacecraft Data, ISSI Scientific Reports, 1998 |
|
Contact:Adrian Blagau |
| Grupul de Plasma Spatiala si Magnetometrie (GPSM) | Copyright ©2006 by GPSM. Maintained by Webmaster |