 |
|
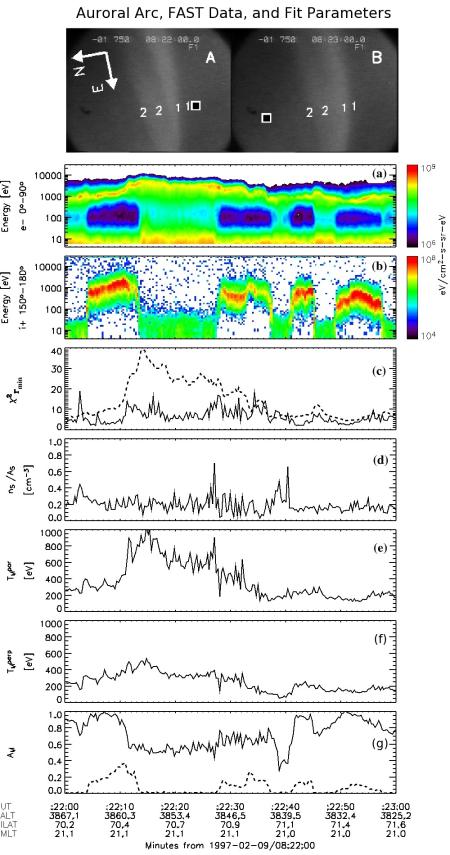
Fig. 1 Ground images (top), FAST electron and ion
energy spectrograms (a, b), and fit parameters (c-g). The images
are taken at 8:22:00 (A) and 8:23:00 (B), the time limits of the
interval under study. Except for a 200m/s southward drift, the arc
remains stable during this interval. FAST ionospheric footprint is
shown as a square. '11' and '22' indicate the limits of the first
two ion beams, as seen by the satellite. The sequence of ion beams
visible in panel (b) suggests repeated encounters of FAST with the
AARBB. The fit parameters panels show the fit quality,
$\chi^2_{r_{min}}$ (c), the density (d), parallel and
perpendicular temperature (e, f), and anisotropy (g). The scaled
profiles of the potential drop above and below the satellite are
dashed plotted in the panels (c) and (g), respectively.
|
|

|
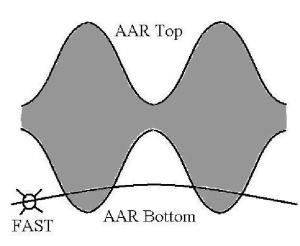
Fig. 2 Cartoon showing the 'dilation' and
'contraction' of the AAR. When the AARBB is located at low
altitudes, below FAST, the AARTB is 'pushed' to higher
altitudes.
Experimental (e. g. McFadden et al., 1999; Mozer and Hull, 2001) and simulation (e. g. Ergun et al., 2000) studies suggest that one can speak about the top and bottom boundaries of the Auroral Acceleration Region (AAR). This is consistent with the fact that different plasmas, as in the ionosphere, AAR, and plasma sheet, tend to be separated by relatively narrow layers that concentrate substantial potential drops. A FAST case study (Marghitu et al., 2006) showed that the anisotropy of precipitating auroral electrons (obtained by fitting a bi-maxwellian function to the measured particle distributions) tends to raise up to 1 (circular contours in the velocity space) during ion beam events and to decrease to < 1 (elliptical contours) in between (Fig. 1). A possible explanation of this behavior relies on the altitudinal dilation of the AAR during ion beam events and contraction in between (Fig. 2). When the AAR top boundary (AARTB) is at a higher altitude, just a small fraction of the particles from above the AAR in a narrow, quasi-circular sector of the velocity space, around the magnetic field line makes it to the satellite, and the anisotropy information is lost. When the AARTB is at lower altitude, more particles, from a larger fraction of the velocity space, reach the satellite, and some of the anisotropy information is preserved. A configuration as sketched in Fig. 2 is consistent with simulation results obtained by Ergun et al. (2000), who found that the AAR bottom boundary (AARBB) consists of an electron transition layer , while the AARTB consists of an ion transition layer . The AARBB is located at the altitude where the density of backscattered and secondary electrons is equal to the beam ions density, of ionospheric origin, while the AARTB forms at the altitude where the density of beam ions is equal to the density of magnetospheric ions. The altitude of the AARBB depends on the field-aligned current density and on the atmospheric scale height. Assuming this scenario is true, when the AARBB is located closer to the Earth (i.e. FAST observes ion beams), the source of ionospheric ions that fill the flux tube inside the AAR is more abundant, therefore these ions dilute to magnetospheric densities at a higher altitude. This would explain the simultaneous expansion of the AAR both in downward and upward direction. However, more data need to be evaluated in order to check the relationship between the anisotropy of precipitating auroral electrons and the altitude of the AAR.
|
|
