|
|
|
Application of 2D-CTTVA on more magnetopause crossings by Cluster
By a closely inspection of Cluster data, more magnetopause (MP) crossing events have been identified when this boundary assumes a 2D, non-planar shape. Several such cases have been analyzed with the 2D-CTTVA method, obtaining information about the MP dynamics and properties. The results have been compared with the outcome provided by the standard planar techniques.
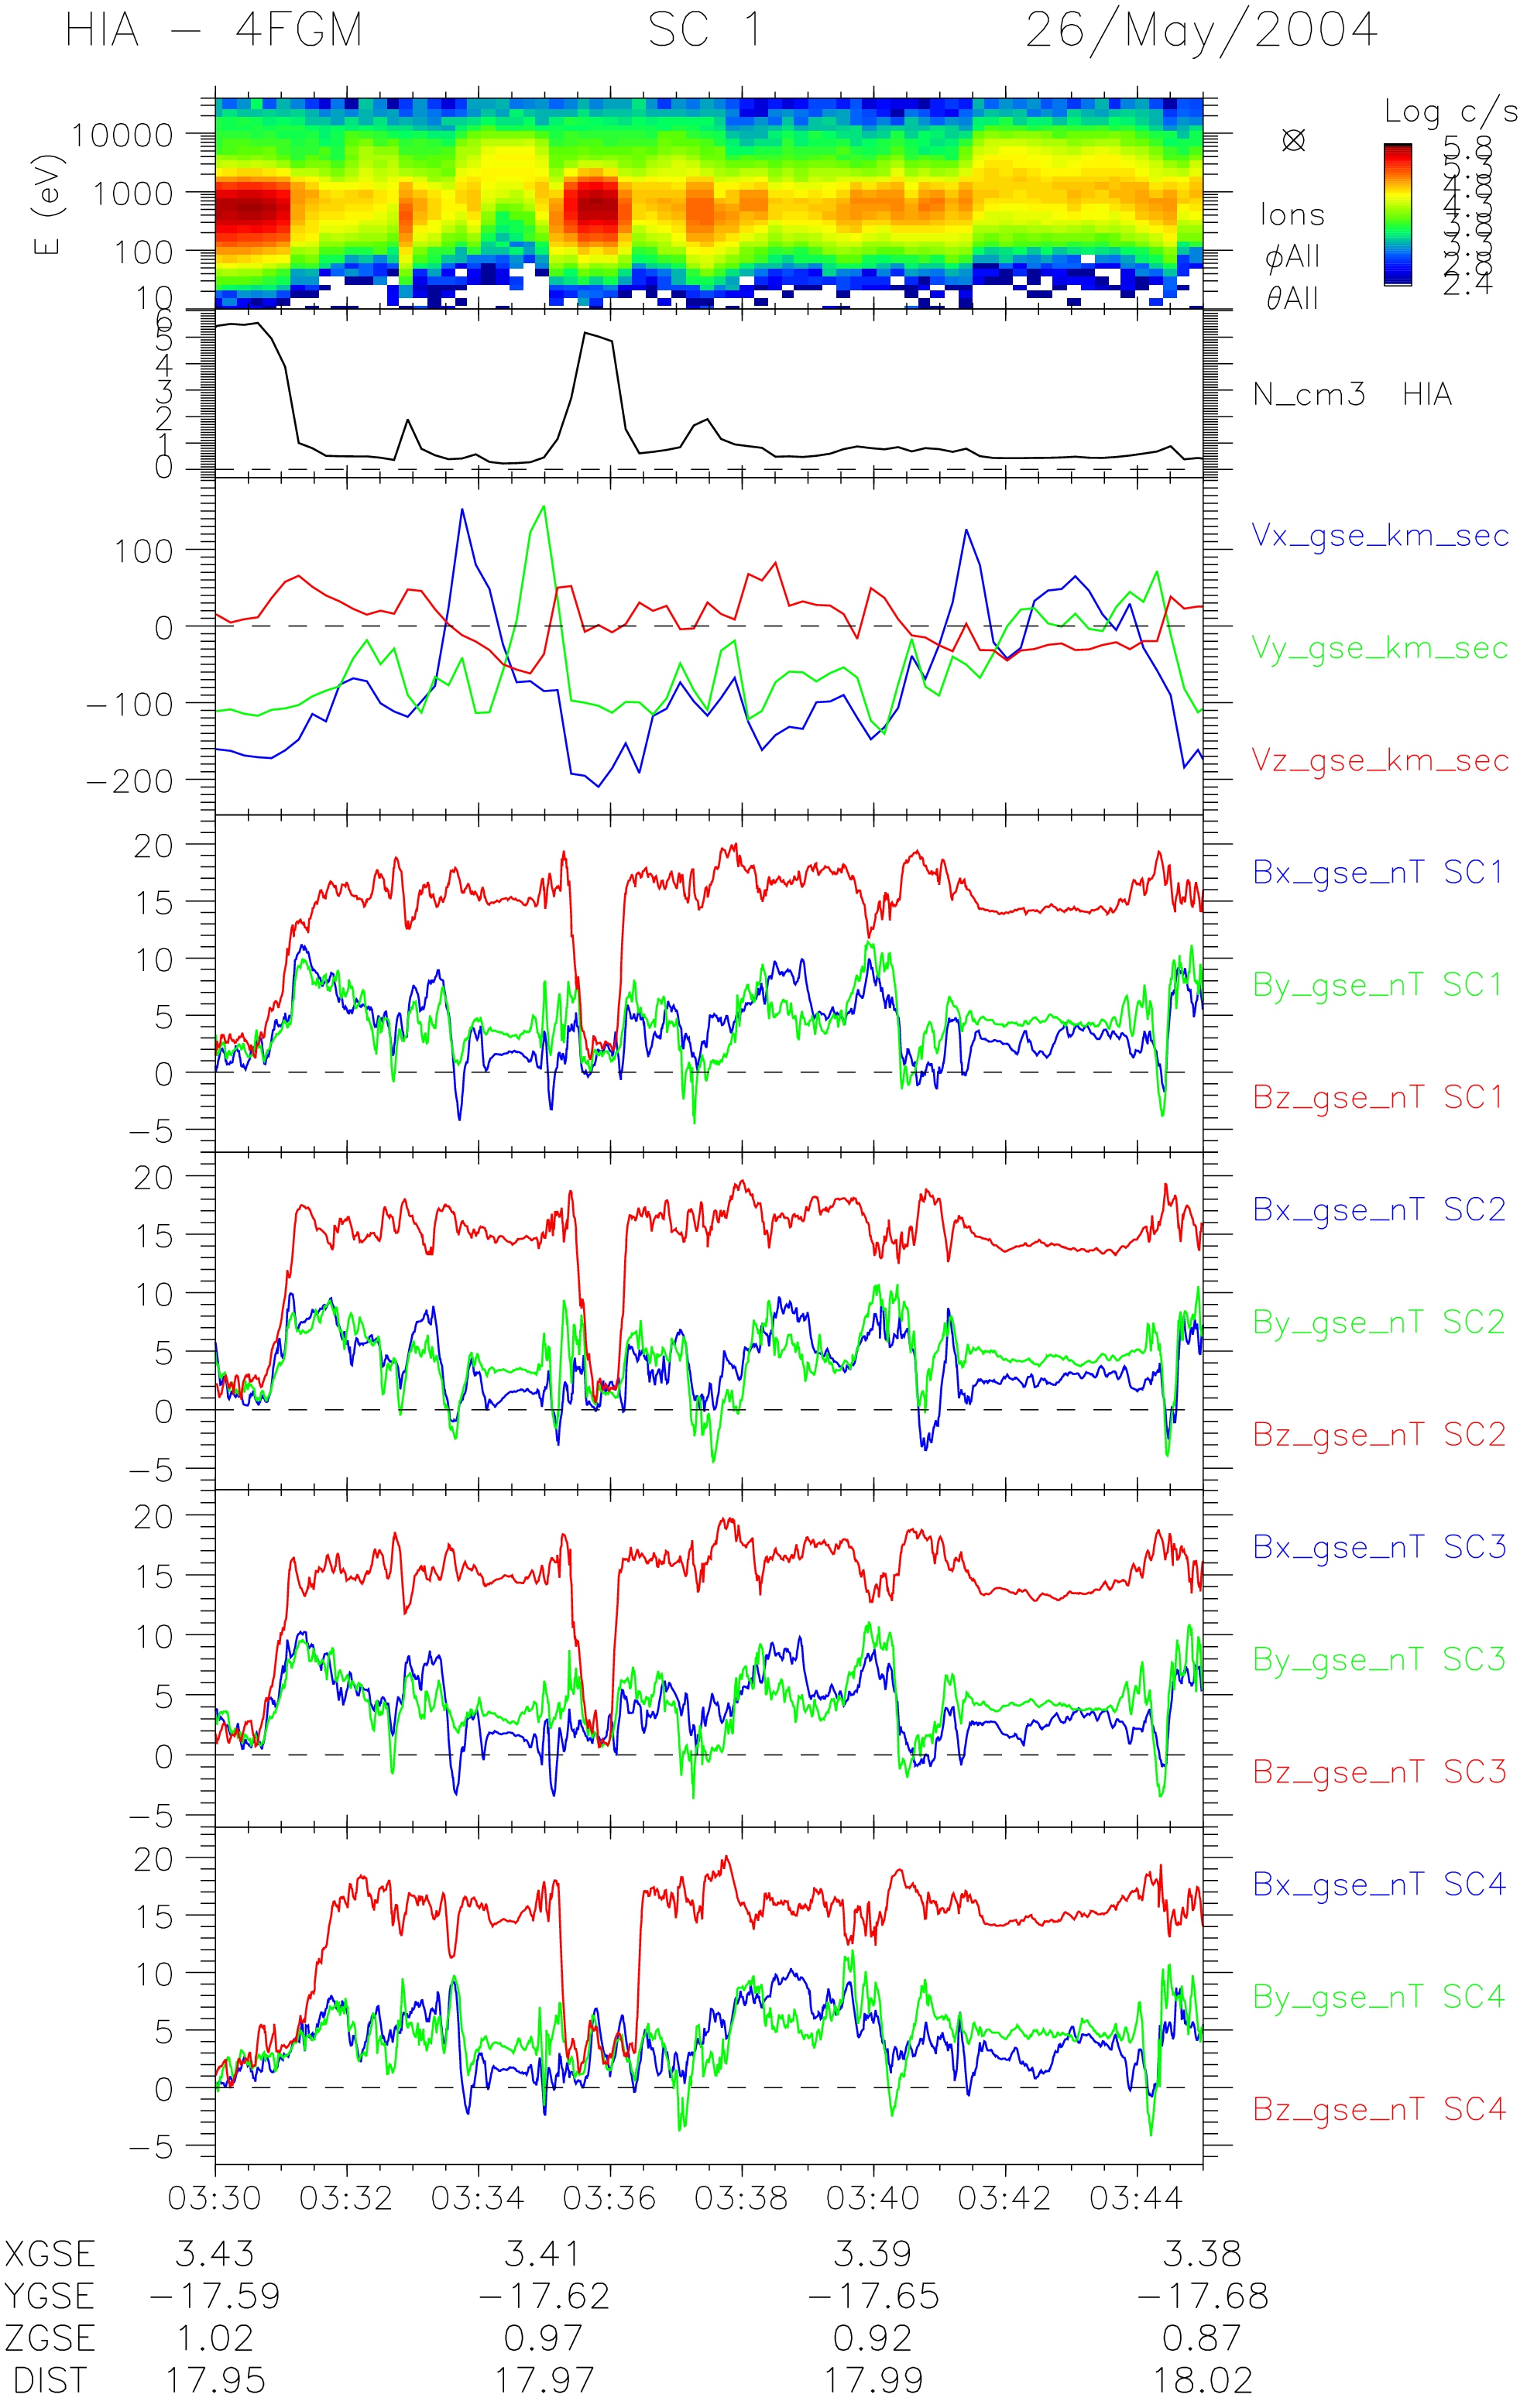
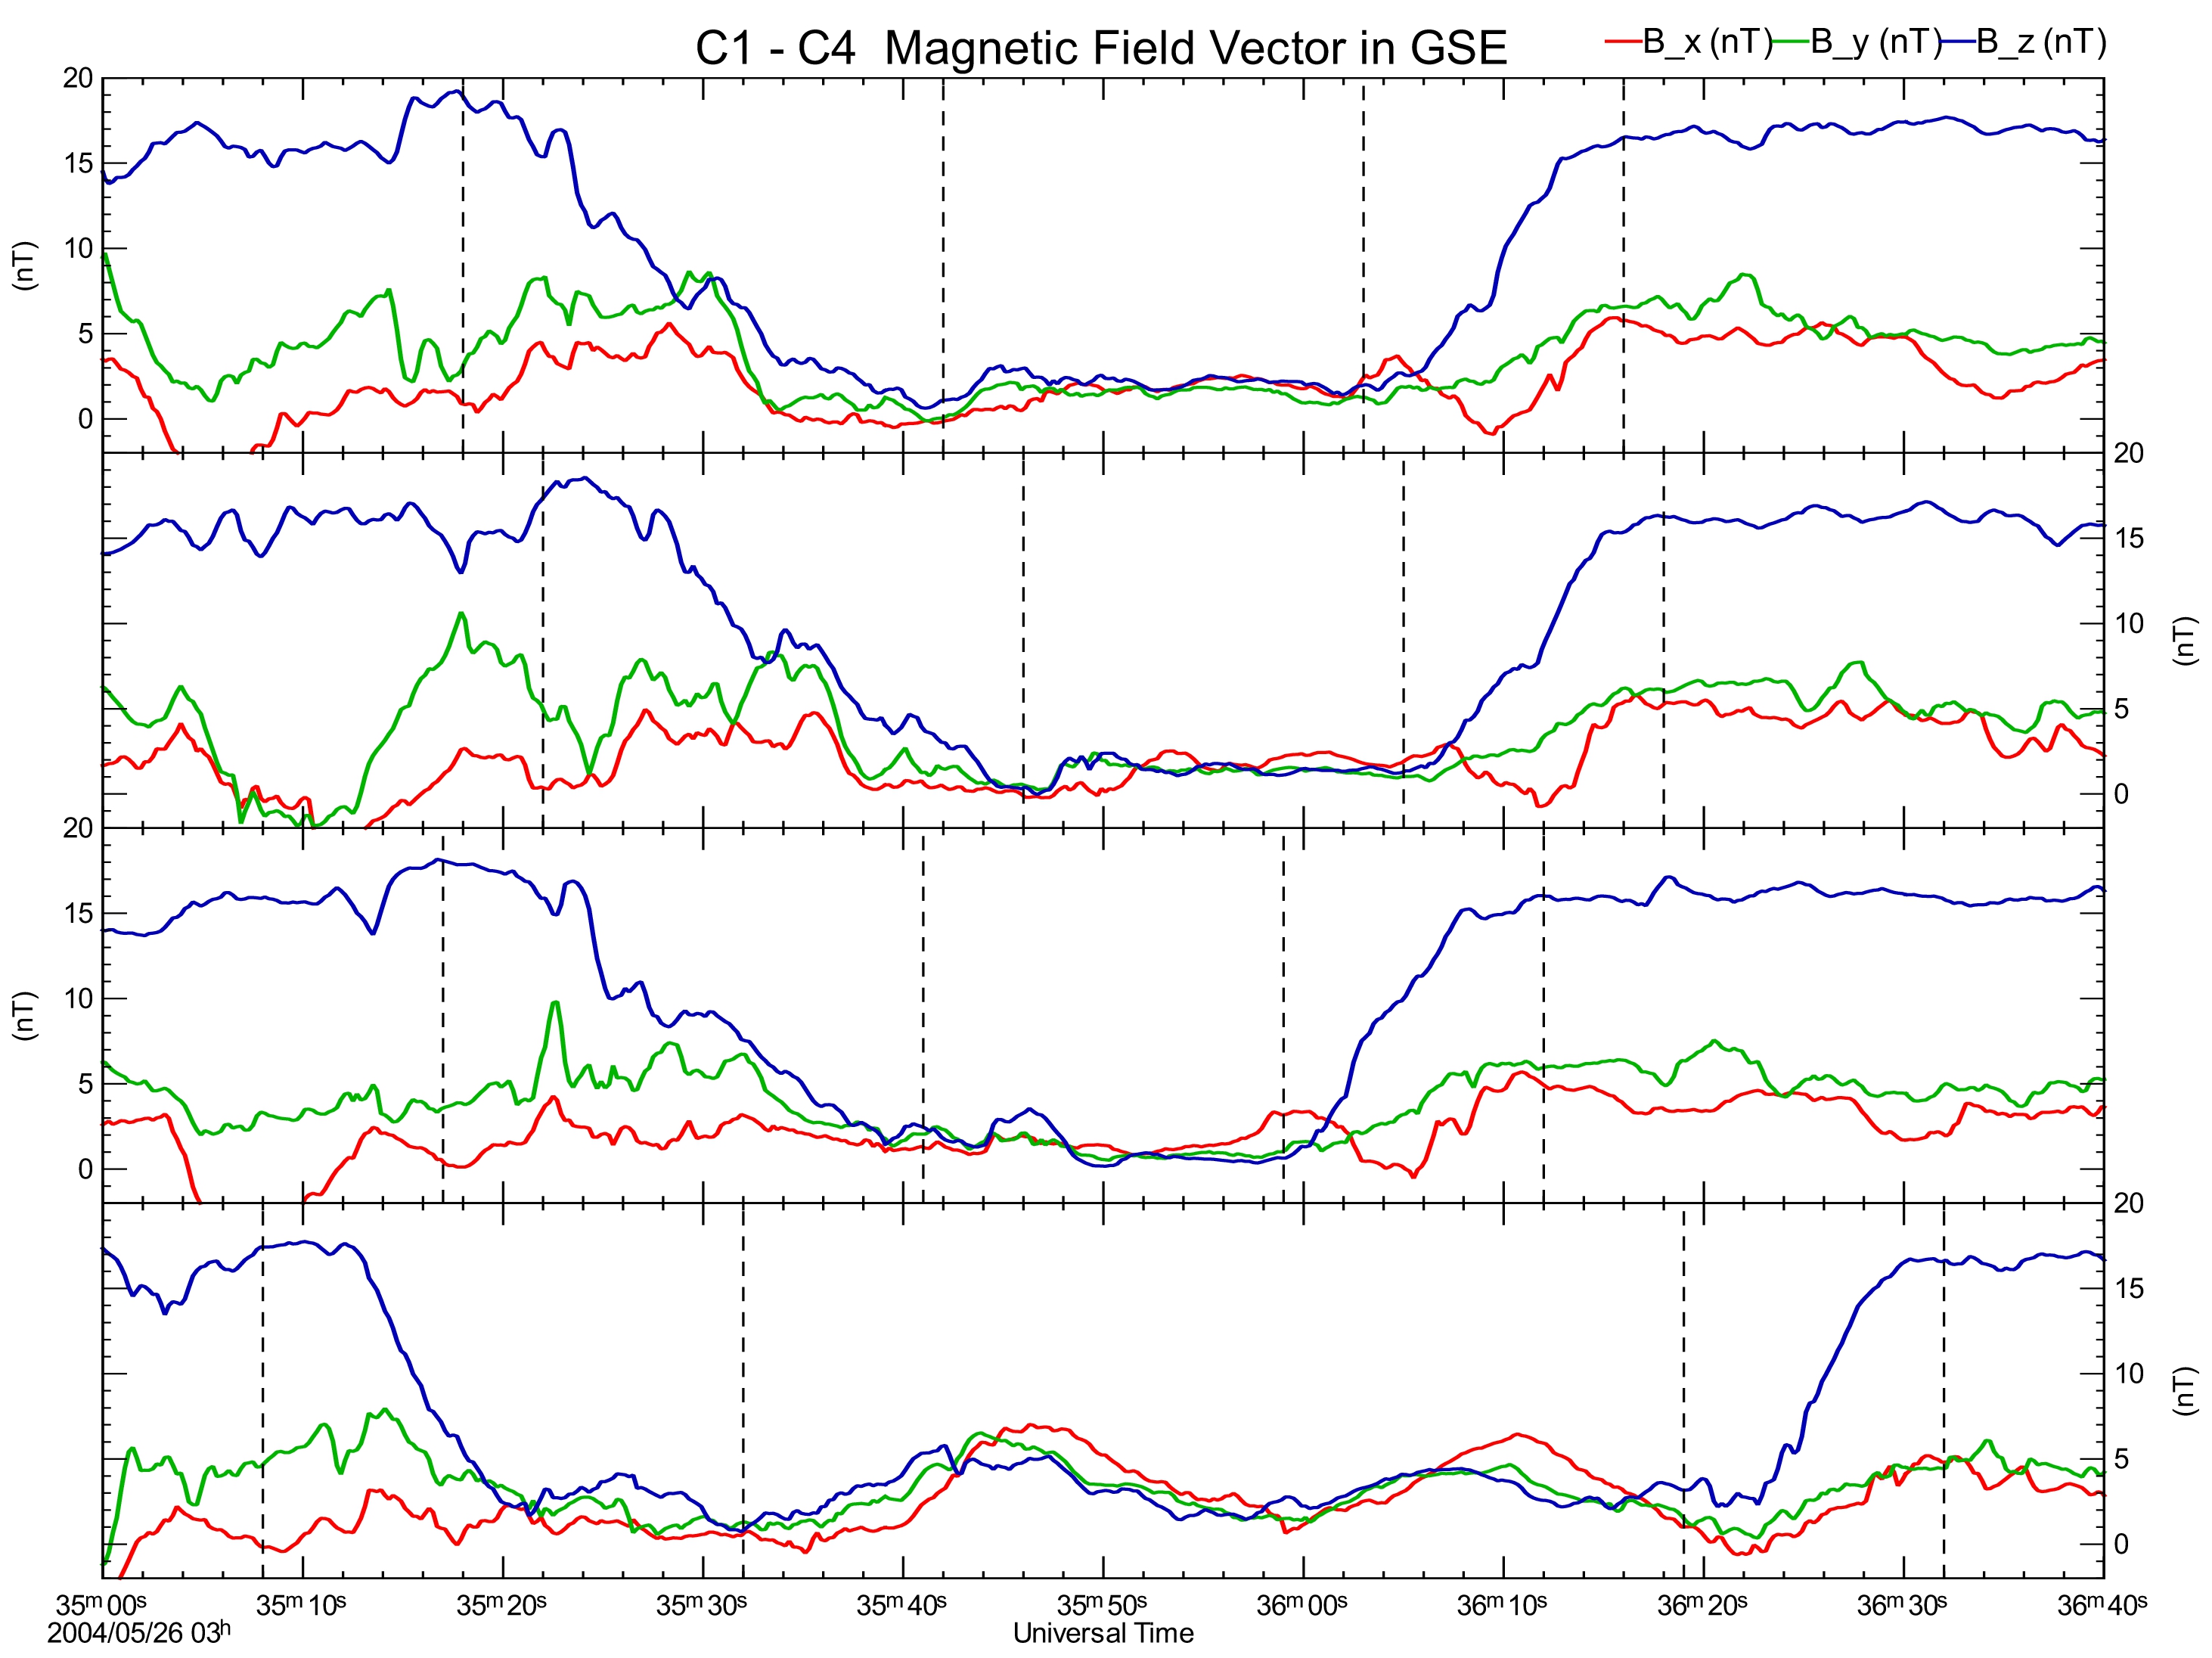
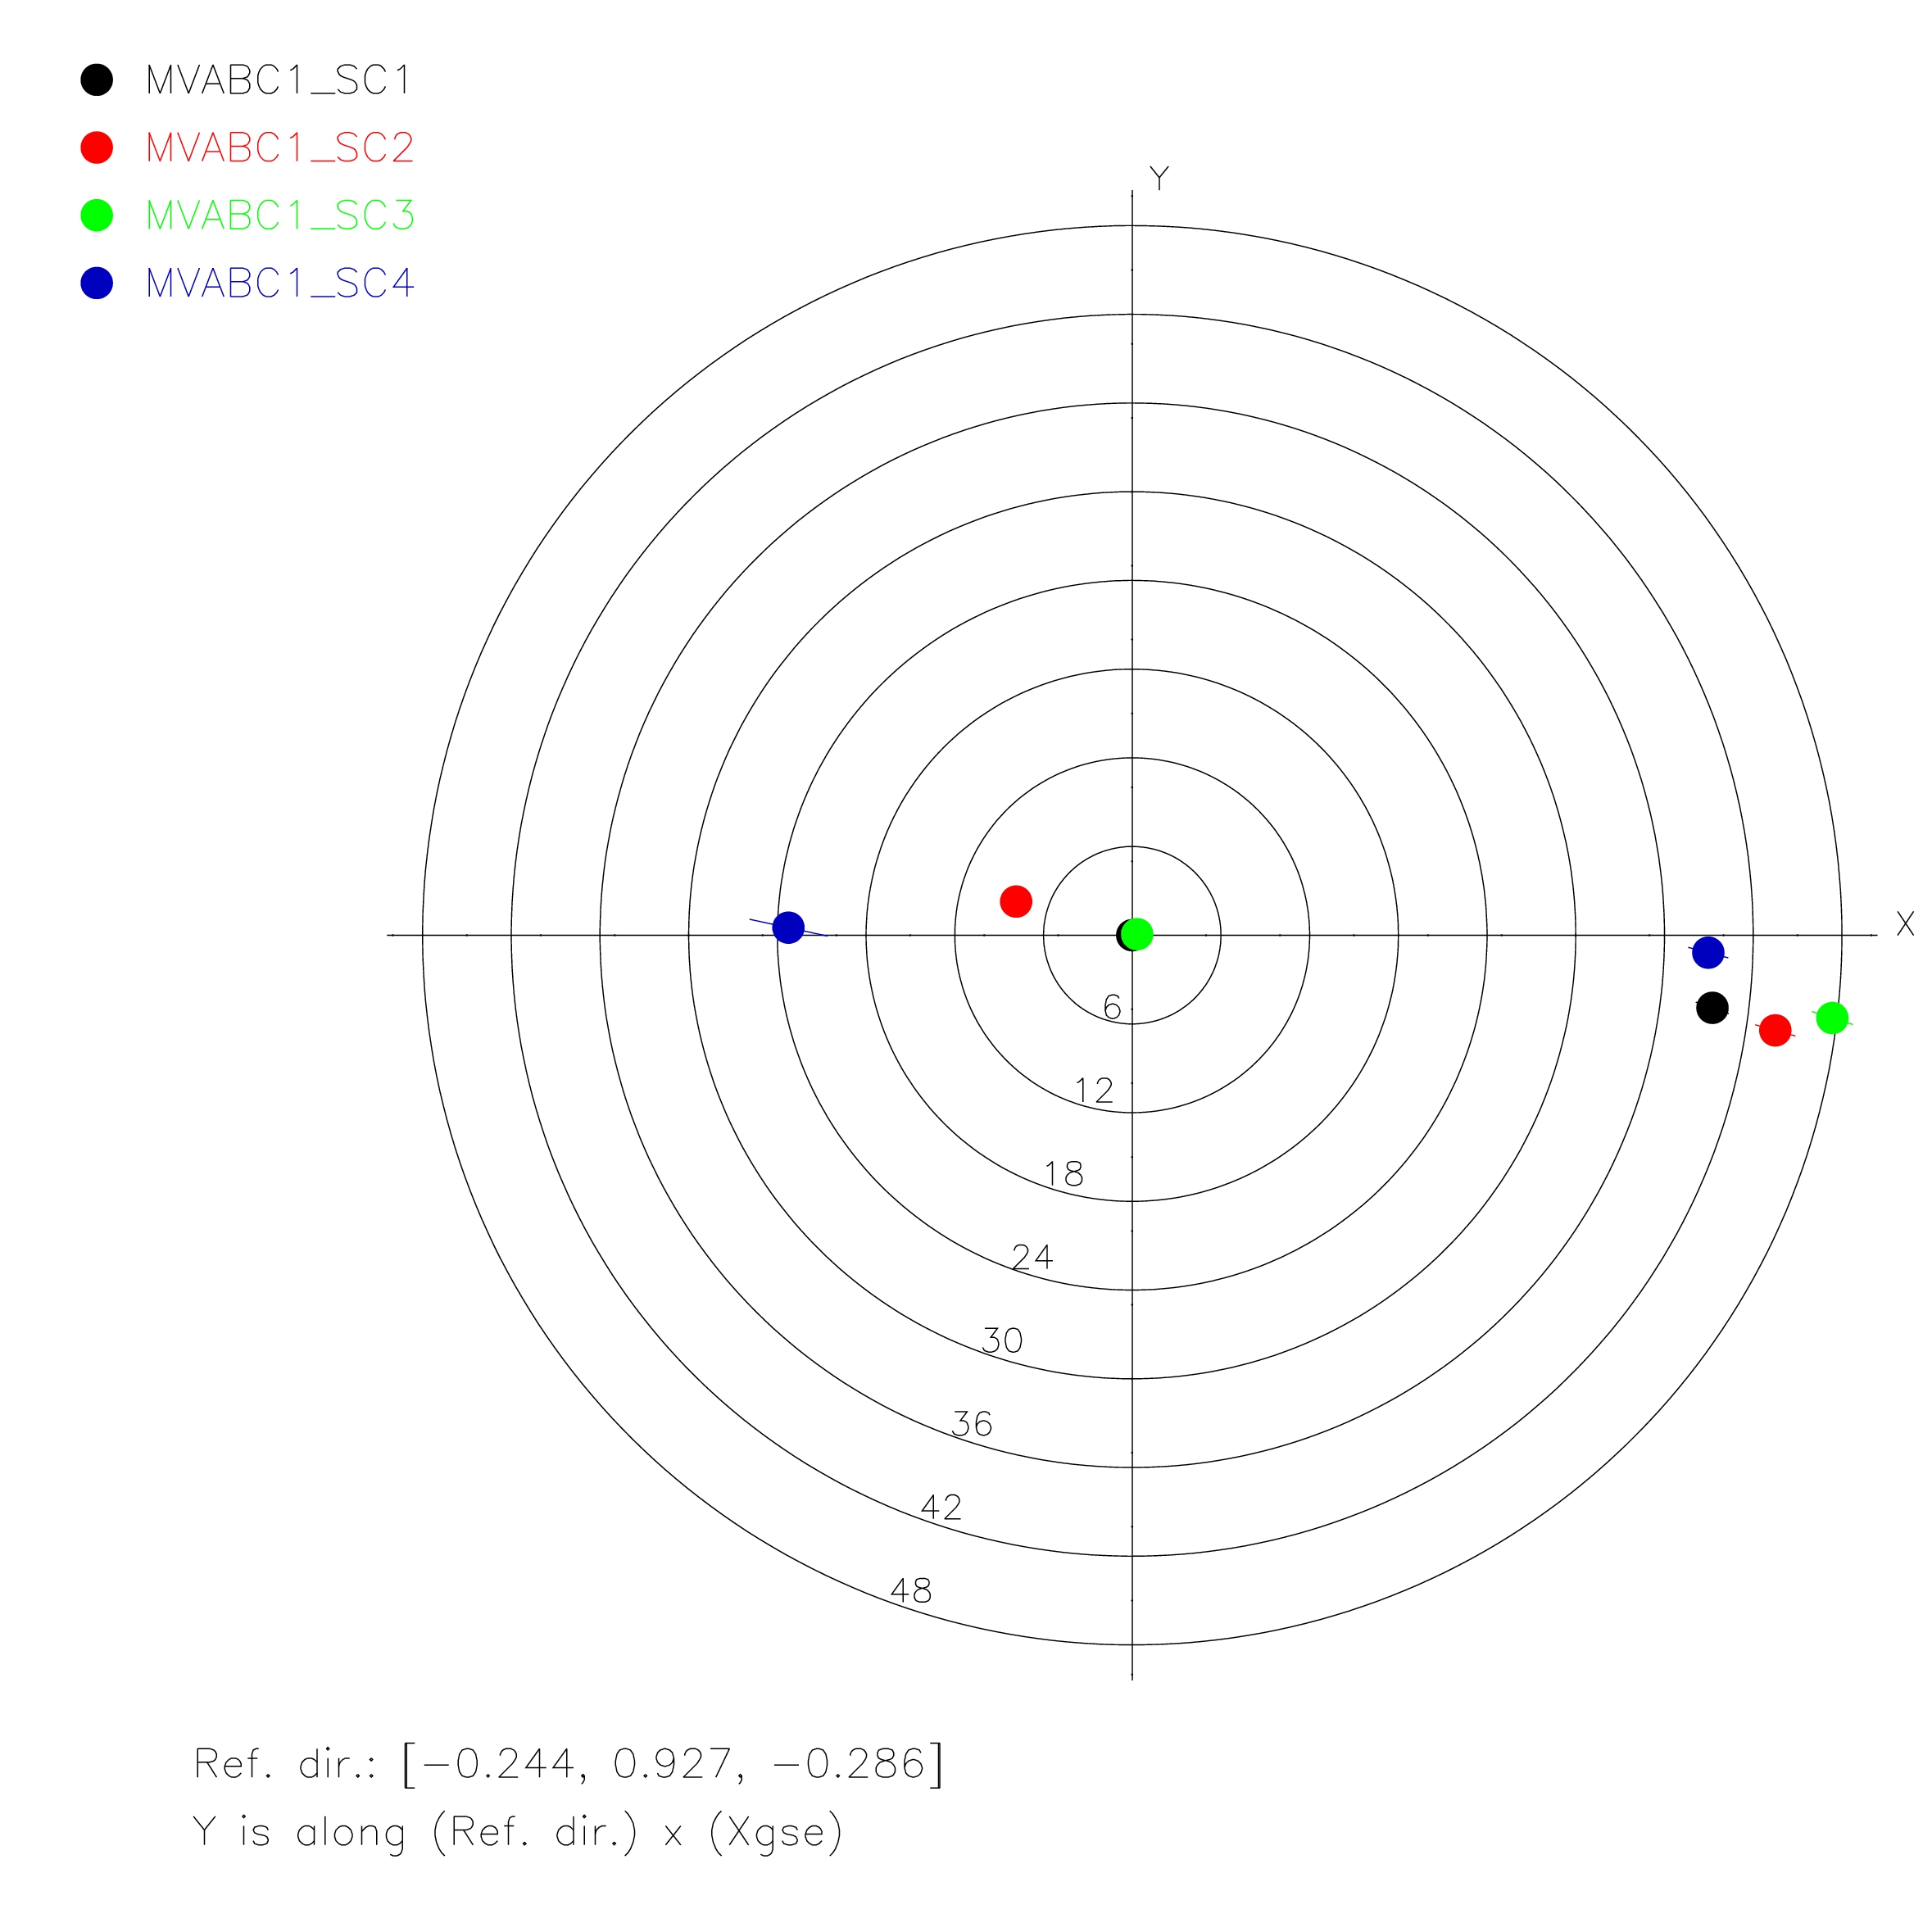
One such example is presented in Figure 3. On the left: the standard plot used to identify MP crossings by Cluster is presented. The first three panels show the HIA energy spectrogram, ion density and GSE components of the plasma bulk velocity as measured by Cluster 1. The remaining panels present the GSE components of the magnetic field vectors measured by all Cluster satellites. Three MP crossings can be identified, occurring around 03:32 (inbound), 03:35 (outbound) and 03:37 (inbound). On the right: The upper figure presents a detailed view of the MP transitions around 03:35 and 03)37. The magnetic field evolution is relatively smooth, allowing thus a precise determination of the timing information. For each transition, the MP orientation has been obtained by applying the minimum variance analysis on the intervals indicated by vertical dashed lines. The figure on the bottom is similar to Figure 1, showing the MP normal orientation with respect to a reference direction in space (center of the figure). The first group of normals, closer to the reference direction, refer to the 03:35 crossing, whereas the second group, inclined with more than 40 deg. from the reference direction, belong to the 03:37 crossing. All the normals are roughly spread along a line, indicating a 2-D, non-planar shape for the MP. This suit of event is even more interesting since the solution ordained from one transition can be mathematically extrapolated in time and compared with the situation encountered at the other transition.
|
|
|
Fig. 3 Example of 2D, non-planar MP crossings encountered by Cluster. The spacecraft was in a tetrahedral configuration, with the inter-satellite separation distance of about 1000 km.
|
|
|
Error calculations
The errors in estimating the parameters of a discontinuity with 2D-CTTVA in real events have various sources (inaccuracy in timing and position, fluctuation in the measurements etc). The most important contribution comes from the timing inaccuracy. In Vogt et al, 2011,. a method is proposed to estimate this quantity based on some general assumptions about the data fluctuation (residuals) in the discontinuity profile, like time-stationary, randomness, small amplitude etc.
The method has been adapted to the MP context where, in general, the small amplitude assumption does not hold. Programs have been implemented to 'propagate' different source of errors through the 2D-CTTVA method and the errors in macroscopic parameters of the MP have been estimated in several crossing events.
|
|
|
Further development of the 2D-CTTVA method
Instead of using the divergence free character of the magnetic field, one can in principle chose other conservation law to optimize the solutions provided by the 2D-CTTVA method, such as e.g. the Faraday law. The solutions obtained in this way will comply with the requirement that, in the discontinuity reference frame, the fluctuation in the tangential electric field component are minimized. This development has been implemented in the 2D-CTTVA method and applied to one MP crossing by Cluster.
Another new feature implemented in the method refers to the possibility to analyze also planar discontinuities, as a limiting case of the 2D discontinuity with an infinite radius of curvature. Contrary to the standard planar techniques, that rely either on e.g. magnetic field data or on the timing, the new development of the method combines in a self-consistent manner both type of information. In addition, since data from all satellites are combined in the analysis, the statistical relevance of the results increases.
Other more complex profiles have been tried, in accordance with the observations reporting on the MP surface waves having a steeper leading or trailing edge. Polynomial functions have been used to characterize the new profiles. Several difficulties have been encountered during this approach. One relates to the bigger difficulties in finding and sorting solutions (necessarily, involving numerical algorithms) that are acceptable from physical perspective. Then, since the total number of unknowns that can be determined with 2D-CTTVA is fixed, less parameters are available to characterize the motion of a more complex profile. Inconclusive results were obtained when the new profiles were used on real MP transitions.
|
|
|
Testing 2D-CTTVA method on synthetic data
The method ability to estimate the geometry and dynamics of a 2-D non-planar discontinuity has been tested on synthetic data. For that purpose, an array of four sensors, designating the Cluster satellite, was propagated through an ideal field structure with cylindrical symmetry and different parameters (curvature, thickness, velocity, acceleration). Several conclusions on the method capabilities were drawn based on its ability to recover the actual geometrical and dynamical parameters of the simulated structure.
For example, for a more accurate estimation, the discontinuity radius of curvature should be much grater than its thickness, otherwise the dynamical and geometrical effects become too entangled to be separated. In addition, a strong discontinuity acceleration hampers the ability to find a physically acceptable solution through numerical algorithms. For 'reasonable' discontinuity parameters, the global magnetic field variance provided by 2D-CTTVA is smaller than the magnetic field variance provided by the standard, i.e. planar, magnetic variance analysis, proving thus the good capabilities of the new method.
|
|
|
Experimental Test of the &rho(1-&alpha) Evolution for Rotational Discontinuities: Cluster Magnetopause Observations
Rotational discontinuities (RDs) in plasma allow a magnetic connection between the plasma regimes they separate. In case of the terrestrial MP, all magnetic reconnection models predict the formation of RDs.
Based on a model discontinuity which assumes time-stationarity and planar geometry, with all parameters varying only along the normal direction, the conservation laws provide two defining relations for an RD. One is the Walen relation predicting that the plasma flows at a local characteristic velocity (Alfven velocity) in the frame of reference (the so-called deHoffmann-Teller frame) in which the flow is aligned with the magnetic field. Another relation connects the variation in plasma mass density, &rho, to variations in the pressure anisotropy factor, &alpha, so that &rho(1-&alpha) is constant.
The Walen test proved to be very successful and become the standard tool in establishing whether a discontinuity has rotational character or not, even if the factor of proportionality between the plasma velocity in the deHoffmann-Teller frame and the Alfven velocity is usually less than the ideal value of one required by the theory. Contrary to that, the &rho(1-&alpha) = const. condition has never been directly verified at the same time, largely due to problems with determining &rho when no ion composition measurements were available and to difficulties with testing the basic model assumptions (planarity, stationarity, validity of plasma fluid approximation) in real events.
In the paper we exploit the high time resolution measurements provided by the Cluster instrumentation to directly test the &rho(1-&alpha) = const. condition for three MP crossings, identified as RDs from application of the Walen relation. Various methods have been used to estimate the MP macroscopic parameters and to prove that the transitions comply with the RD model assumptions. We find that, for reasons not presently understood, in neither case the relation &rho(1-&alpha) = const. is fulfilled.
|
|
|
|
|
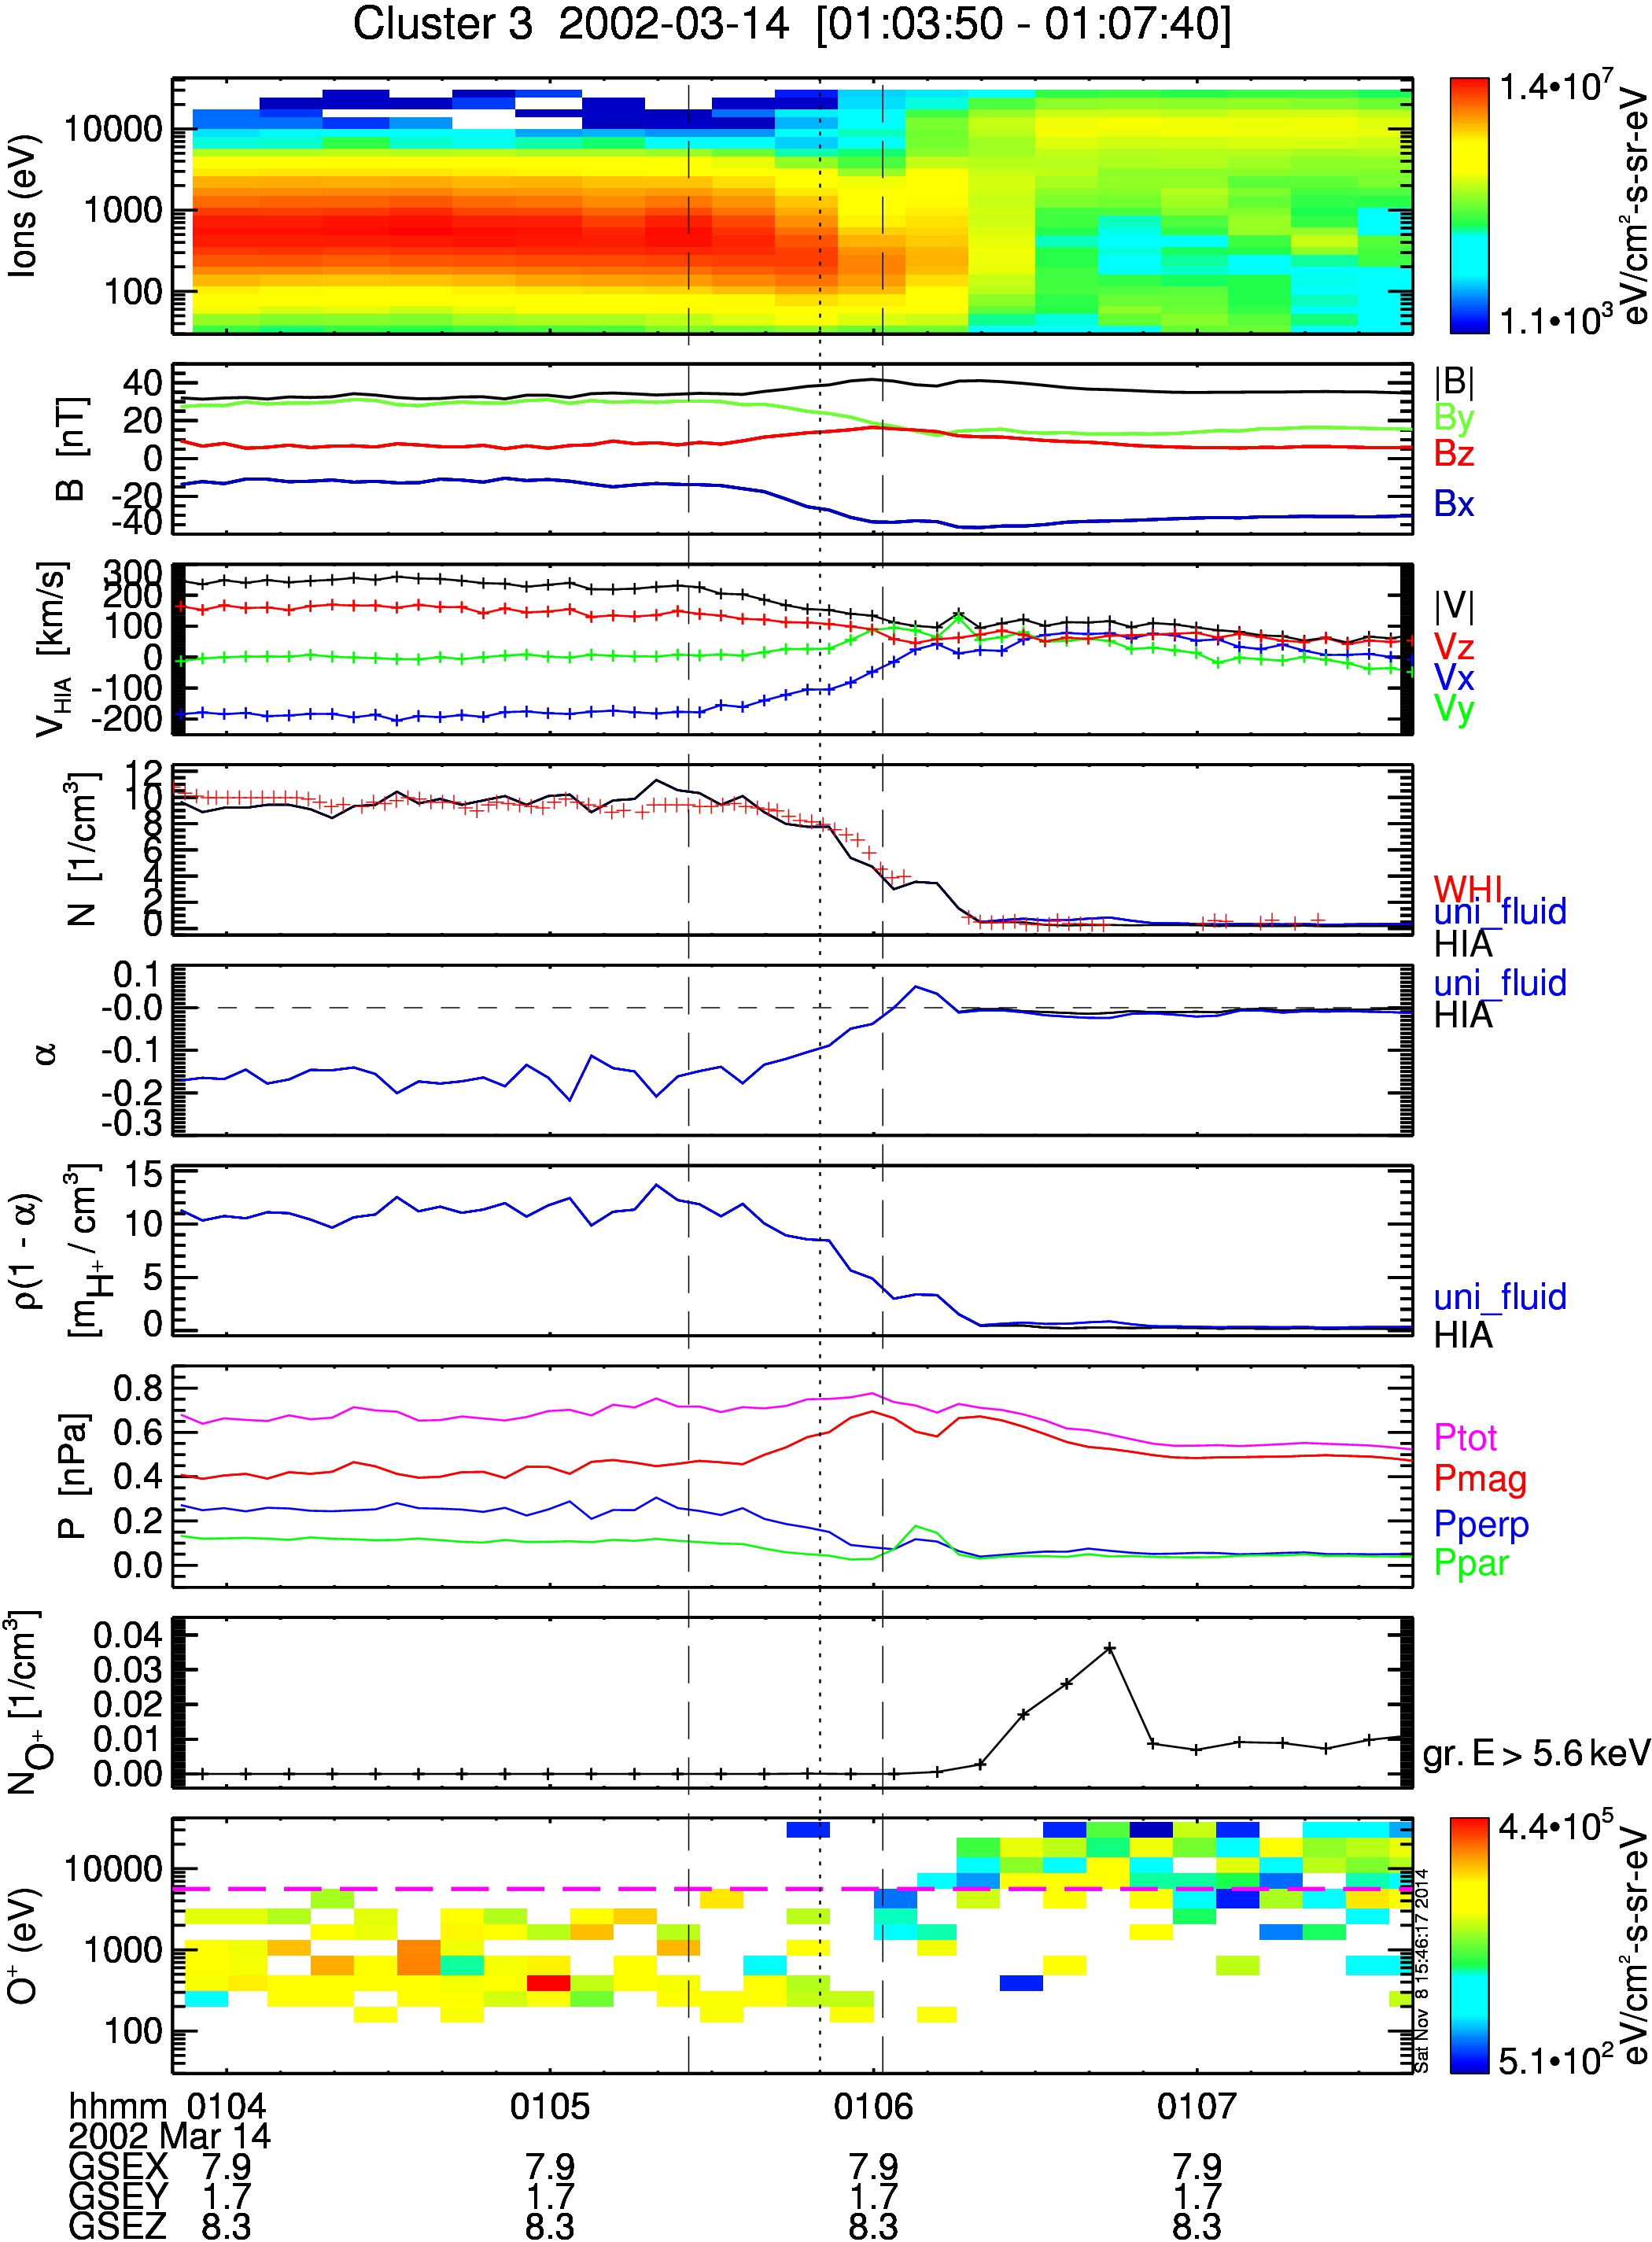
Fig. 4 Magnetic field and plasma data for the inbound crossing from 14 March 2002 by Cluster 3. The top panel shows the HIA energy-flux spectrogram; the next panels show the magnetic field magnitude and components, followed by the HIA bulk velocity magnitude and components; panel 4 shows the HIA density (in black), superimposed on the WHISPER total electron density (red symbols), followed by the pressure anisotropy factor &alpha and &rho(1-&alpha) in panels 5 and 6; panel 7 shows the magnetic field pressure (red), perpendicular (blue) and parallel (green) ion pressure, and the sum of the magnetic and perpendicular ion pressures (magenta). The last two panels give the O+ density and energy spectrogram, as determined from the CODIF measurements. For the O+ density, only the four highest energy channels, roughly above the 5.6 keV threshold indicated by the horizontal magenta line in the last panel, have been taken into account. The magnetic field and plasma bulk velocity components are in GSE coordinates, with x in blue, y in green, and z in red. In panels 4, 5, and 6, the quantities which include the uni-fluid correction are shown in blue. The black vertical dashed lines indicate the interval used for the Walen analysis while the vertical dotted line roughly indicates the center of the current layer. Figure taken from Blagau et al., 2015
|
|
|
|
|